RoadScout already turns a phone on a windscreen into a road-condition survey. The Network Diagnostics API is how you get that data out: a clean, read-only REST API for PCI, IRI, condition distribution, deterioration trends and geolocated defects, plus GeoJSON / KML / Shapefile / CSV export. Point your GIS or asset-management system at it and skip the survey crew.
Most road authorities do not have a data collection problem any more. They have a data integration problem. The condition information exists, somewhere, but it is locked in a portal, a PDF, or a survey vendor's dashboard, and getting it into the systems that actually drive maintenance decisions is the hard part.
The RoadScout Network Diagnostics API is built to remove that friction. It exposes everything we measure about a road network as structured, predictable JSON that an engineer can pull in an afternoon, and as GIS files a planner can open in QGIS before lunch.
A read-only API, on purpose
The public API is entirely read-only. Capture and processing happen inside the RoadScout app and pipeline; the public surface exists purely so you can consume diagnostics. There are no create-trip or upload endpoints to misuse. Just clean reads, scoped to your organization by a Bearer token. That makes it safe to wire into a dashboard, a GIS sync job, or a procurement model without any risk of mutating survey data.
The shape: network, segments, defects
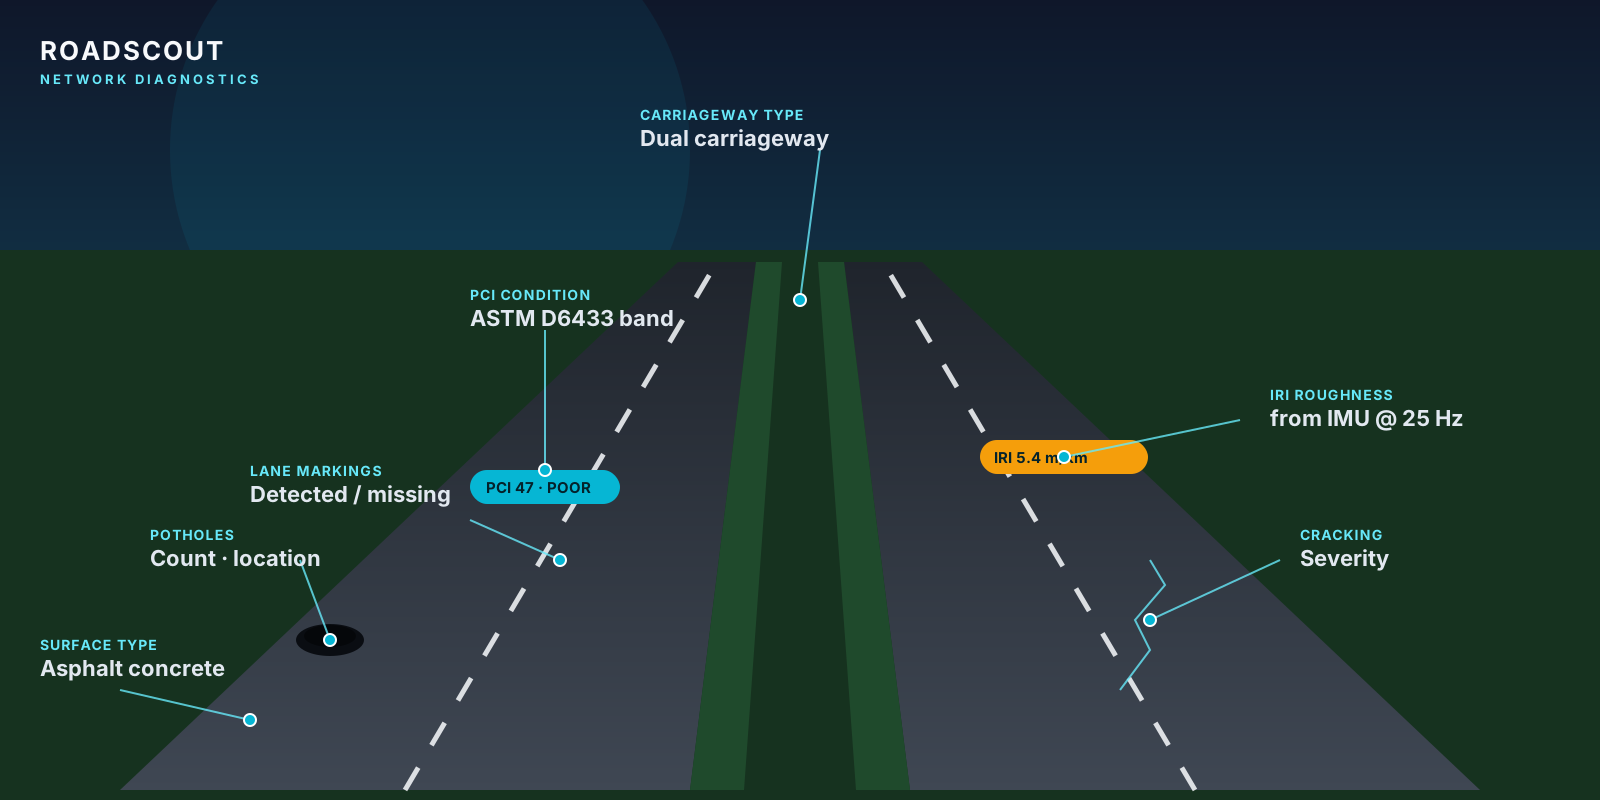
RoadScout splits every surveyed route into roughly 100-metre segments: the unit of network analysis. Each segment carries a condition rating, a roughness estimate, a surface and carriageway classification, and the defects found along it. On a single dual carriageway that means surface type, carriageway type, PCI condition, IRI roughness, lane markings, potholes and cracking, all geolocated.
That structure lets you ask network questions (what share of my network is poor?) and pinpoint questions (where are the worst pothole clusters?) from the same data.
Scoring every segment: PCI and IRI
PCI: Pavement Condition Index
Each segment gets a 0–100 PCI derived from AI-detected defect types, densities and severities, banded on the ASTM D6433 scale (Good, Satisfactory, Fair, Poor, Very Poor, Serious, Failed). We also expose a TMH 5-point visual condition for teams that report against the South African standard. For the difference between the two indices, see our explainer on PCI vs IRI scoring.
IRI: International Roughness Index
Roughness is estimated per segment from the 25 Hz IMU stream and banded in m/km against World Bank / ARRB thresholds. PCI tells you what is visibly wrong; IRI tells you how the road rides. Reporting both per segment is what lets you choose the right treatment instead of guessing.
The diagnostics endpoints
Four read-only groups cover the full picture:
- Analytics:
/analytics/summary,/analytics/pci,/analytics/iri,/analytics/condition-distribution, plus deterioration forecast and benchmark comparison. - Segments:
/segmentsand/segments/{id}for per-segment condition, classification and score history. - Defects:
/events,/events/{id}and/events/summaryfor geolocated potholes, cracks and more, with counts, density and hotspots. - Export:
/export/eventsand/export/segmentsin GeoJSON, KML, Shapefile or CSV.
A first call
Authenticate with a Bearer token and ask for your network summary:
curl -H "Authorization: Bearer YOUR_TOKEN" \
  "https://api.roadscoutai.com/v1/analytics/summary"
You get back network PCI, average IRI, kilometres surveyed, segment count, defect totals and a condition distribution: the headline state of your whole network in one request. Full reference and language examples live in the developer documentation.
Built for integration, not just viewing
Dashboards are nice; integrations are what change outcomes. Every diagnostics dataset can be exported as GeoJSON, KML, Shapefile or CSV with a single request that returns a short-lived download URL. Drop it straight into ArcGIS, QGIS, or a pavement-management system. Coordinates, condition bands and defect attributes come through as first-class fields, so a planner can symbolise a network by PCI band or filter to gravel roads in the wet season without massaging the data first.
One vocabulary, standardised
Roads are classified by a standard surface type (asphalt concrete, surface treatment, concrete, block paving, gravel, and more) and carriageway type. Condition uses the ASTM PCI bands and TMH visual scale; distress is tagged (potholes, rutting, cracking, ravelling, edge deterioration, corrugation, seasonal). Because the same enumerations appear in filters, responses and exports, what you query is exactly what you get back, and exactly what loads into your GIS.
Where this is heading
Two diagnostics are deliberately forward-looking. Deterioration forecasting becomes meaningful as the same roads are re-surveyed over time: RoadScout records a condition snapshot per segment per survey, so the trend line builds itself. Benchmark comparison grows as reference datasets accrue. The endpoints are published today and return an explicit pending-data state until there is enough history, so you can build against a stable contract now and richer answers arrive without an integration change.
If your pavement-management system is starved of fresh, structured condition data, the gap is rarely the road. It is the pipe between the road and your systems. That pipe is what the Network Diagnostics API is for. Start with the API documentation.